open source · JVM · local-first
the agent orchestrator
you can watch.
spectroscope fans the event stream of your agents into discrete, replayable lines, the way a spectroscope fans starlight. Spawn an agent in five lines, gate every tool call, replay every run byte for byte, and watch a whole fleet on one screen.
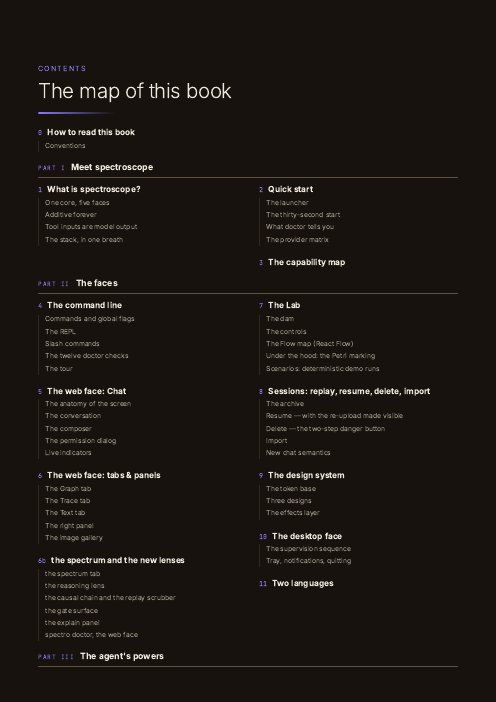
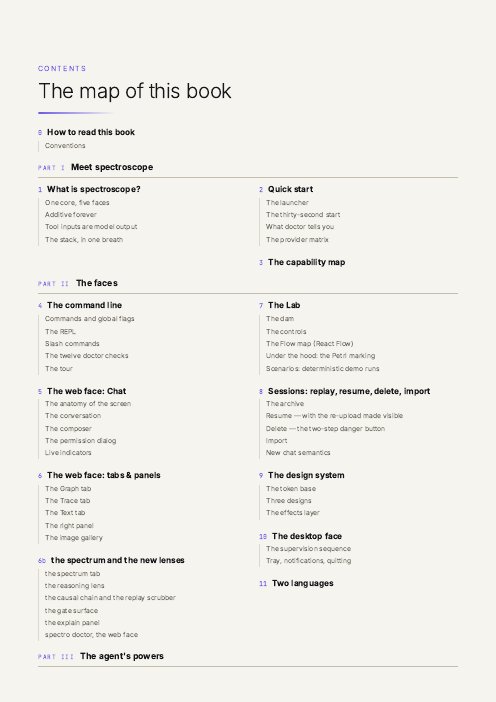
Java 21 · virtual threads · no reactive DSL · permission gate built in
macOS, Linux and other formats
- macOS disk image, Apple silicon268 MB
- macOS Homebrew caskbrew
- Linux AppImage, x86_64259 MB
- Linux .deb, x86_64205 MB
- Linux apt repository, Debian and Ubuntuapt
- Java 21 server jar, any system62 MB
- Java 21 command line, zip40 MB
- Java 21 MCP notes server, zip2.2 MB
- source tag v0.15.5, tar.gz→
- release notes and checksums on GitHub→
emission lines
every event is like a spectral line
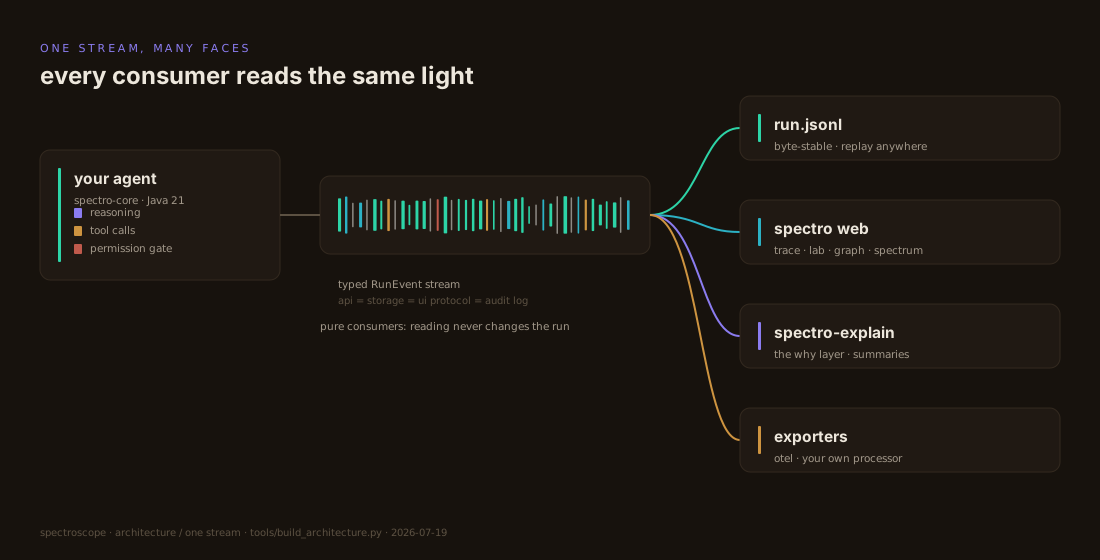
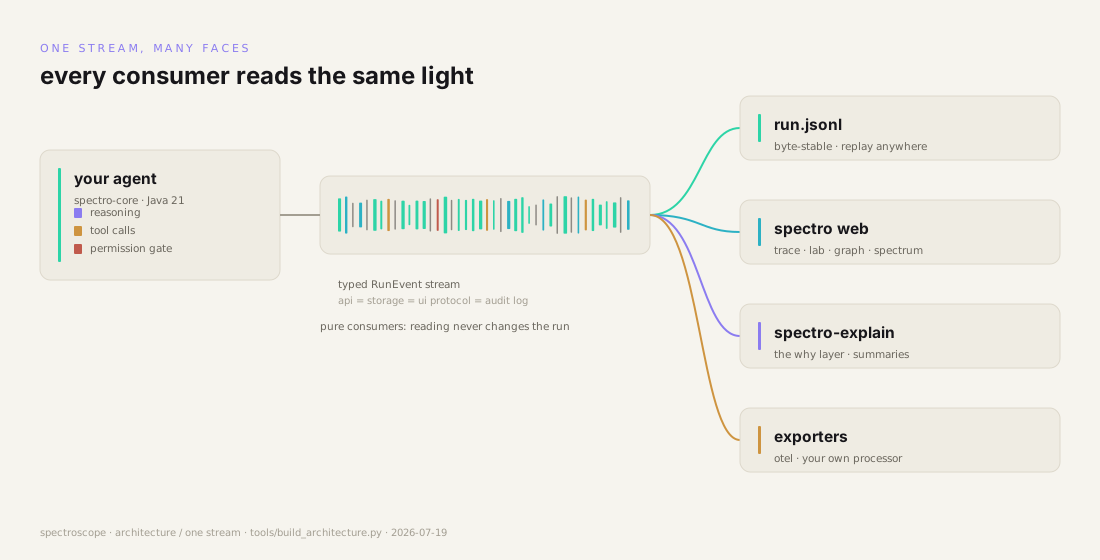
An agent run lands as a stream of typed RunEvents, not a wall of logs: each token, tool call, and permission decision arrives as its own discrete line. One stream is the API, the storage format, the UI protocol, and the audit log, so what you watch is exactly what gets stored.
learn by watching
an agent run you can steer
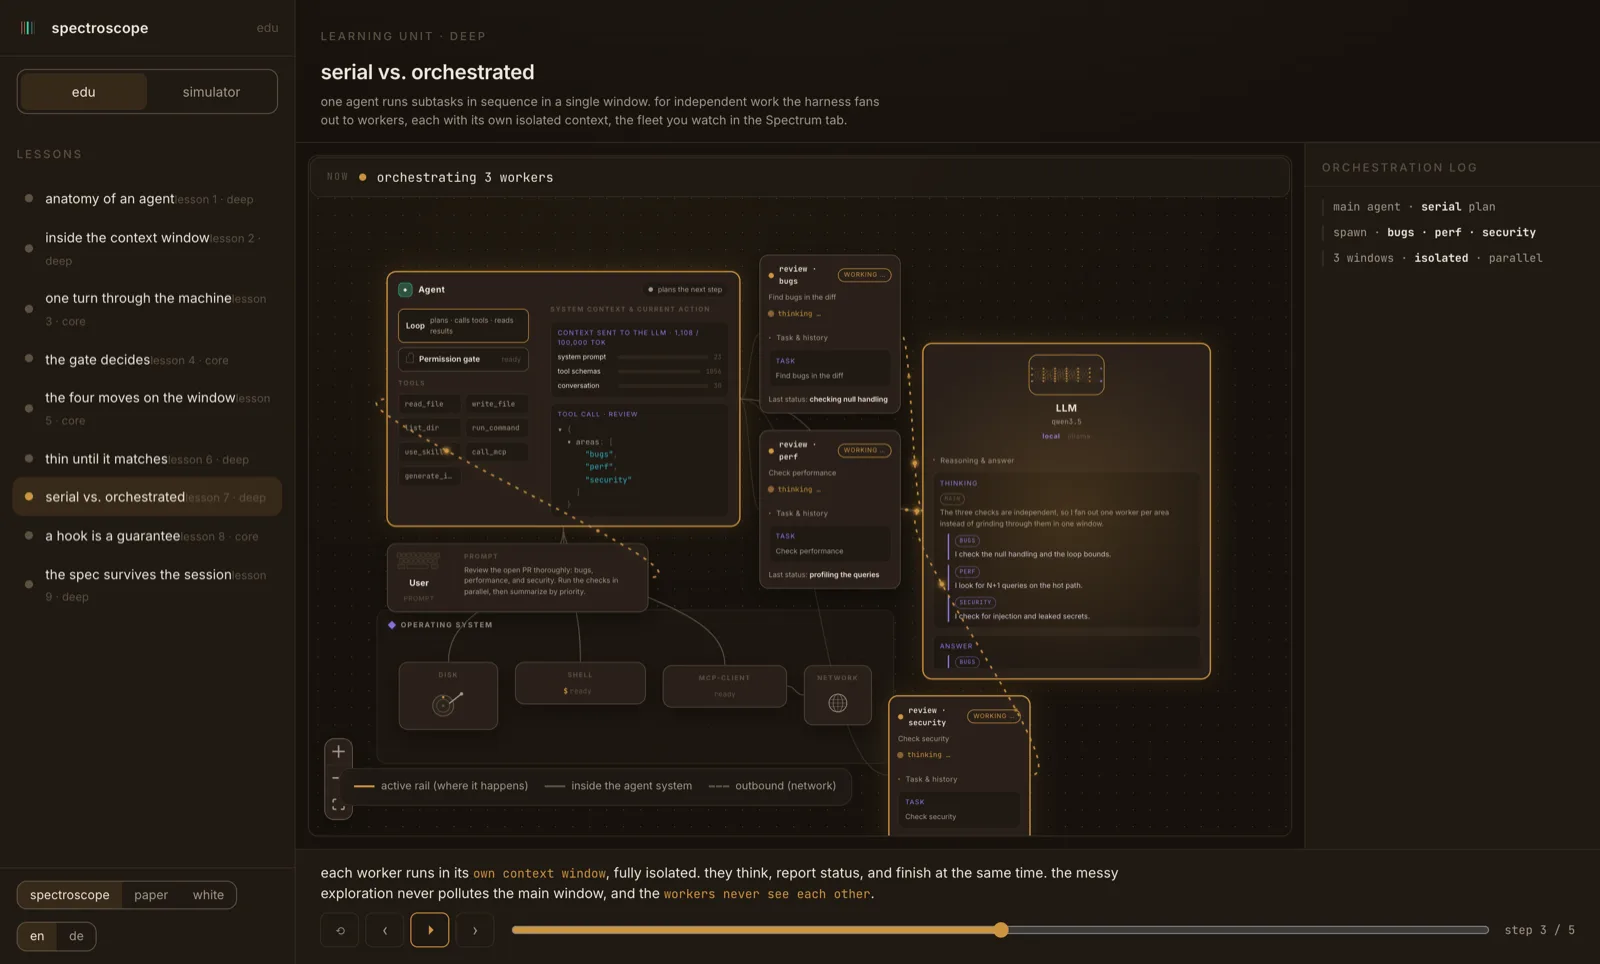
edu.spectroscope.ai runs spectroscope's own UI without a backend. Step a scripted agent run on a live system map, open the same trace and jsonl views, and flip the model from local to remote. Nine short lessons build the agent up one part at a time. No key, no server: it runs from static files, the way the product does.
try the simulator →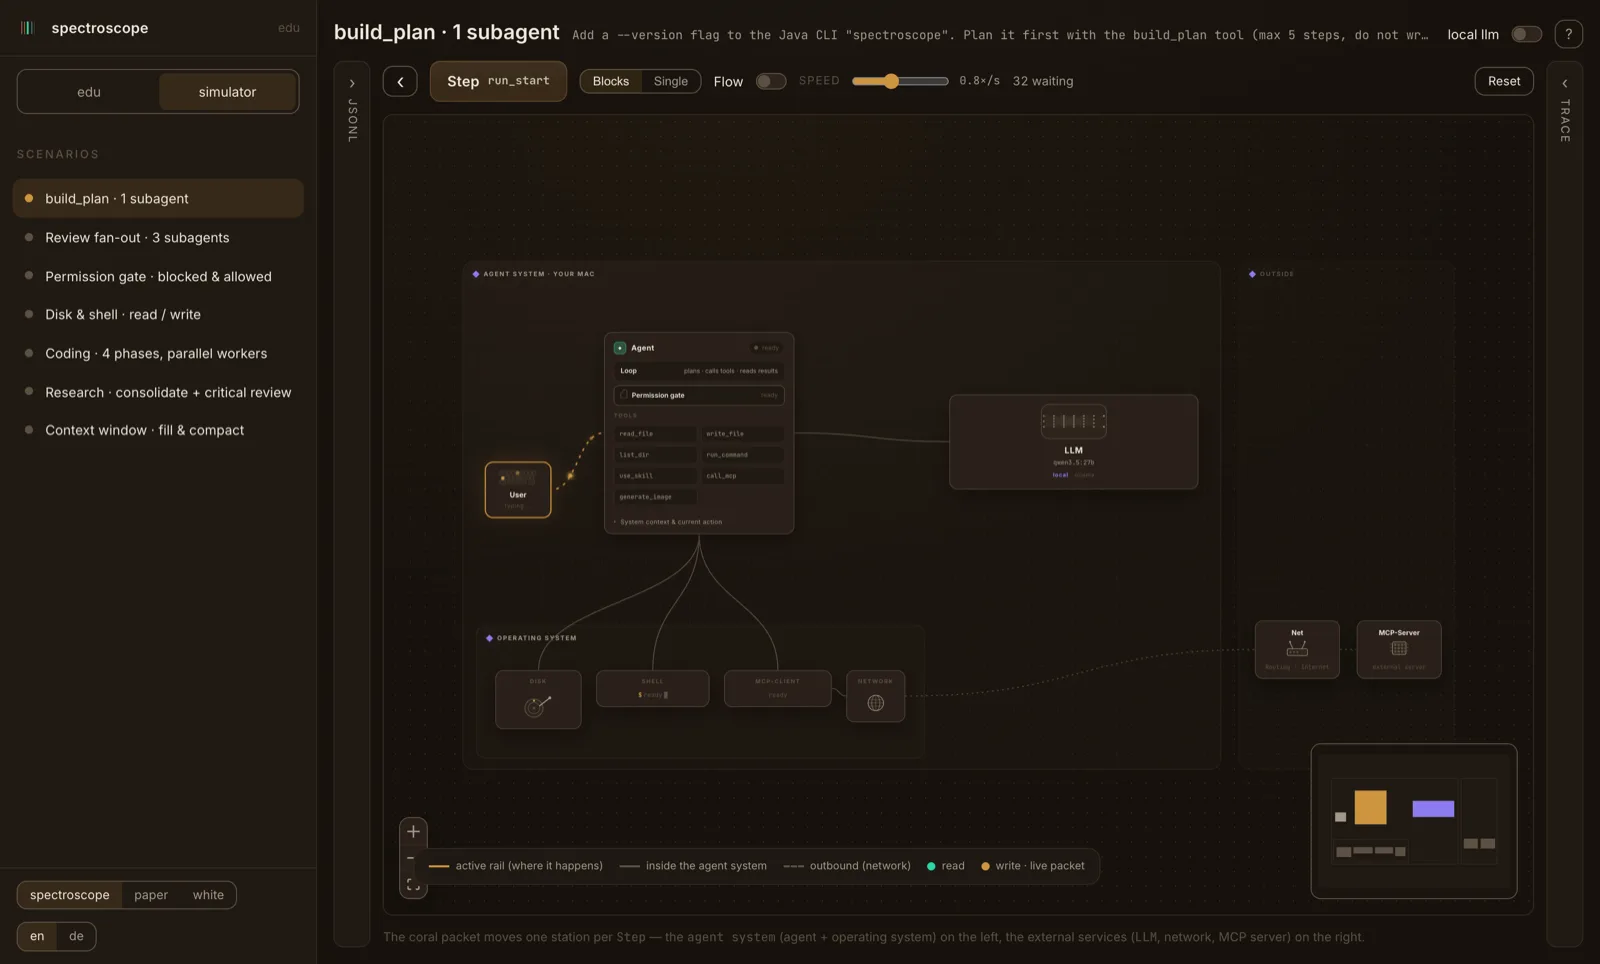
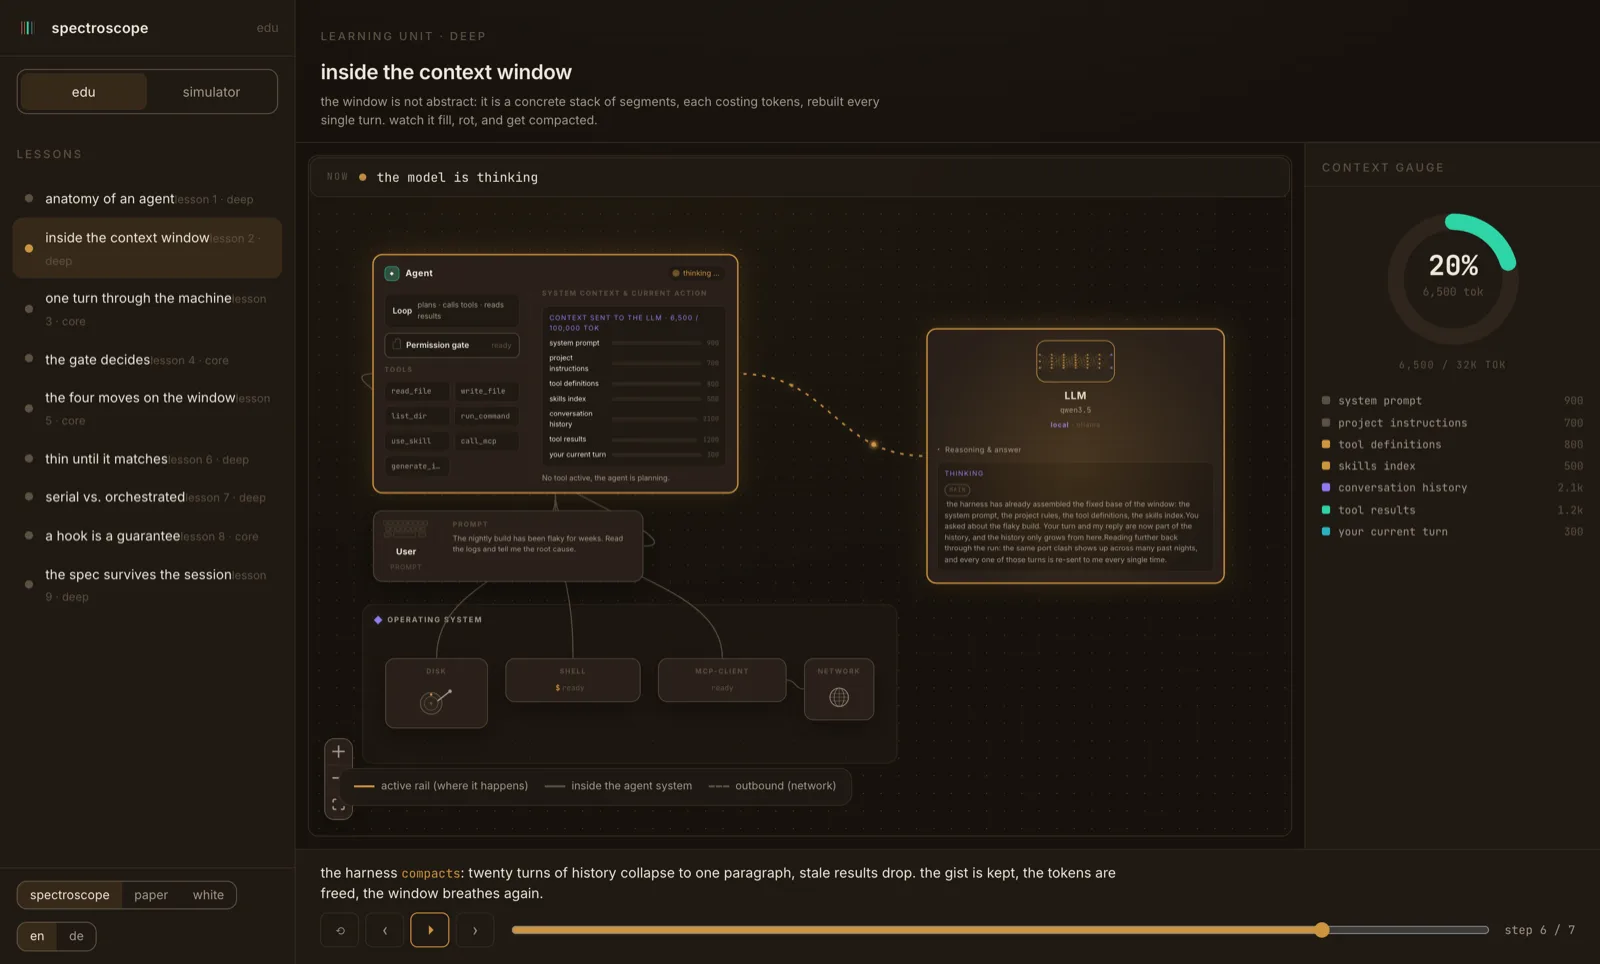
passive observation
watch without disturbing the run
The web UI subscribes to the same RunEvent stream the agent already emits. Opening the Trace view attaches a reader, not a debugger: the run proceeds exactly as it would unobserved. Quantum measurement disturbs what it measures. A spectroscope does not: the light left the star long before it reached the slit. The Trace view works the same way.
Harness
One agent, three parts: a container-free core, a blocking
for (RunEvent e : agent.run(p)) loop on virtual
threads, tools behind a first-class permission gate.
Tool inputs are model output and therefore untrusted.
Orchestrator
Many small agents on a bus: spawn a panel of workers, hand off
tasks with A2A-style task / status / result messages,
and steer the whole fleet. Every exchange is visible in the same
stream; there is no second protocol.
Trace
Every run lands as byte-stable JSONL you can replay in the CLI, the web app, the Lab step-through, or the graph. A session recorded on one machine replays on any other. For a regulated team, the trace file is the audit log.
measurement collapse
nothing runs until you decide
When an agent wants to touch the world, spectroscope holds the action in a pending state and asks. Until you decide, nothing has happened. Your approval or denial collapses the pending call into exactly one recorded outcome, and the decision itself becomes a line in the trace.
tool.runCommand("rm -rf build/")
event: permission.pending · outcome: unresolved
the why layer
spectro-explain: explainable AI, made practical
A spectroscope tells you what the light is made of. Every trace answers what happened; spectro-explain reads the same stream and answers why: which rule made the gate ask, which call caused which result, what a run did in plain language. The rule and the causal chain come straight from the stream, with no model in the loop; only the optional narrative summary calls one.
why did the gate ask
Every permission event joins the rule that fired. No model involved, just the stream: "the gate asked because runCommand is not on the allowlist."
causal chains
Each event carries its cause. Walk any result back to the call, the turn, and the prompt that started it, one hop at a time.
reasoning, recorded
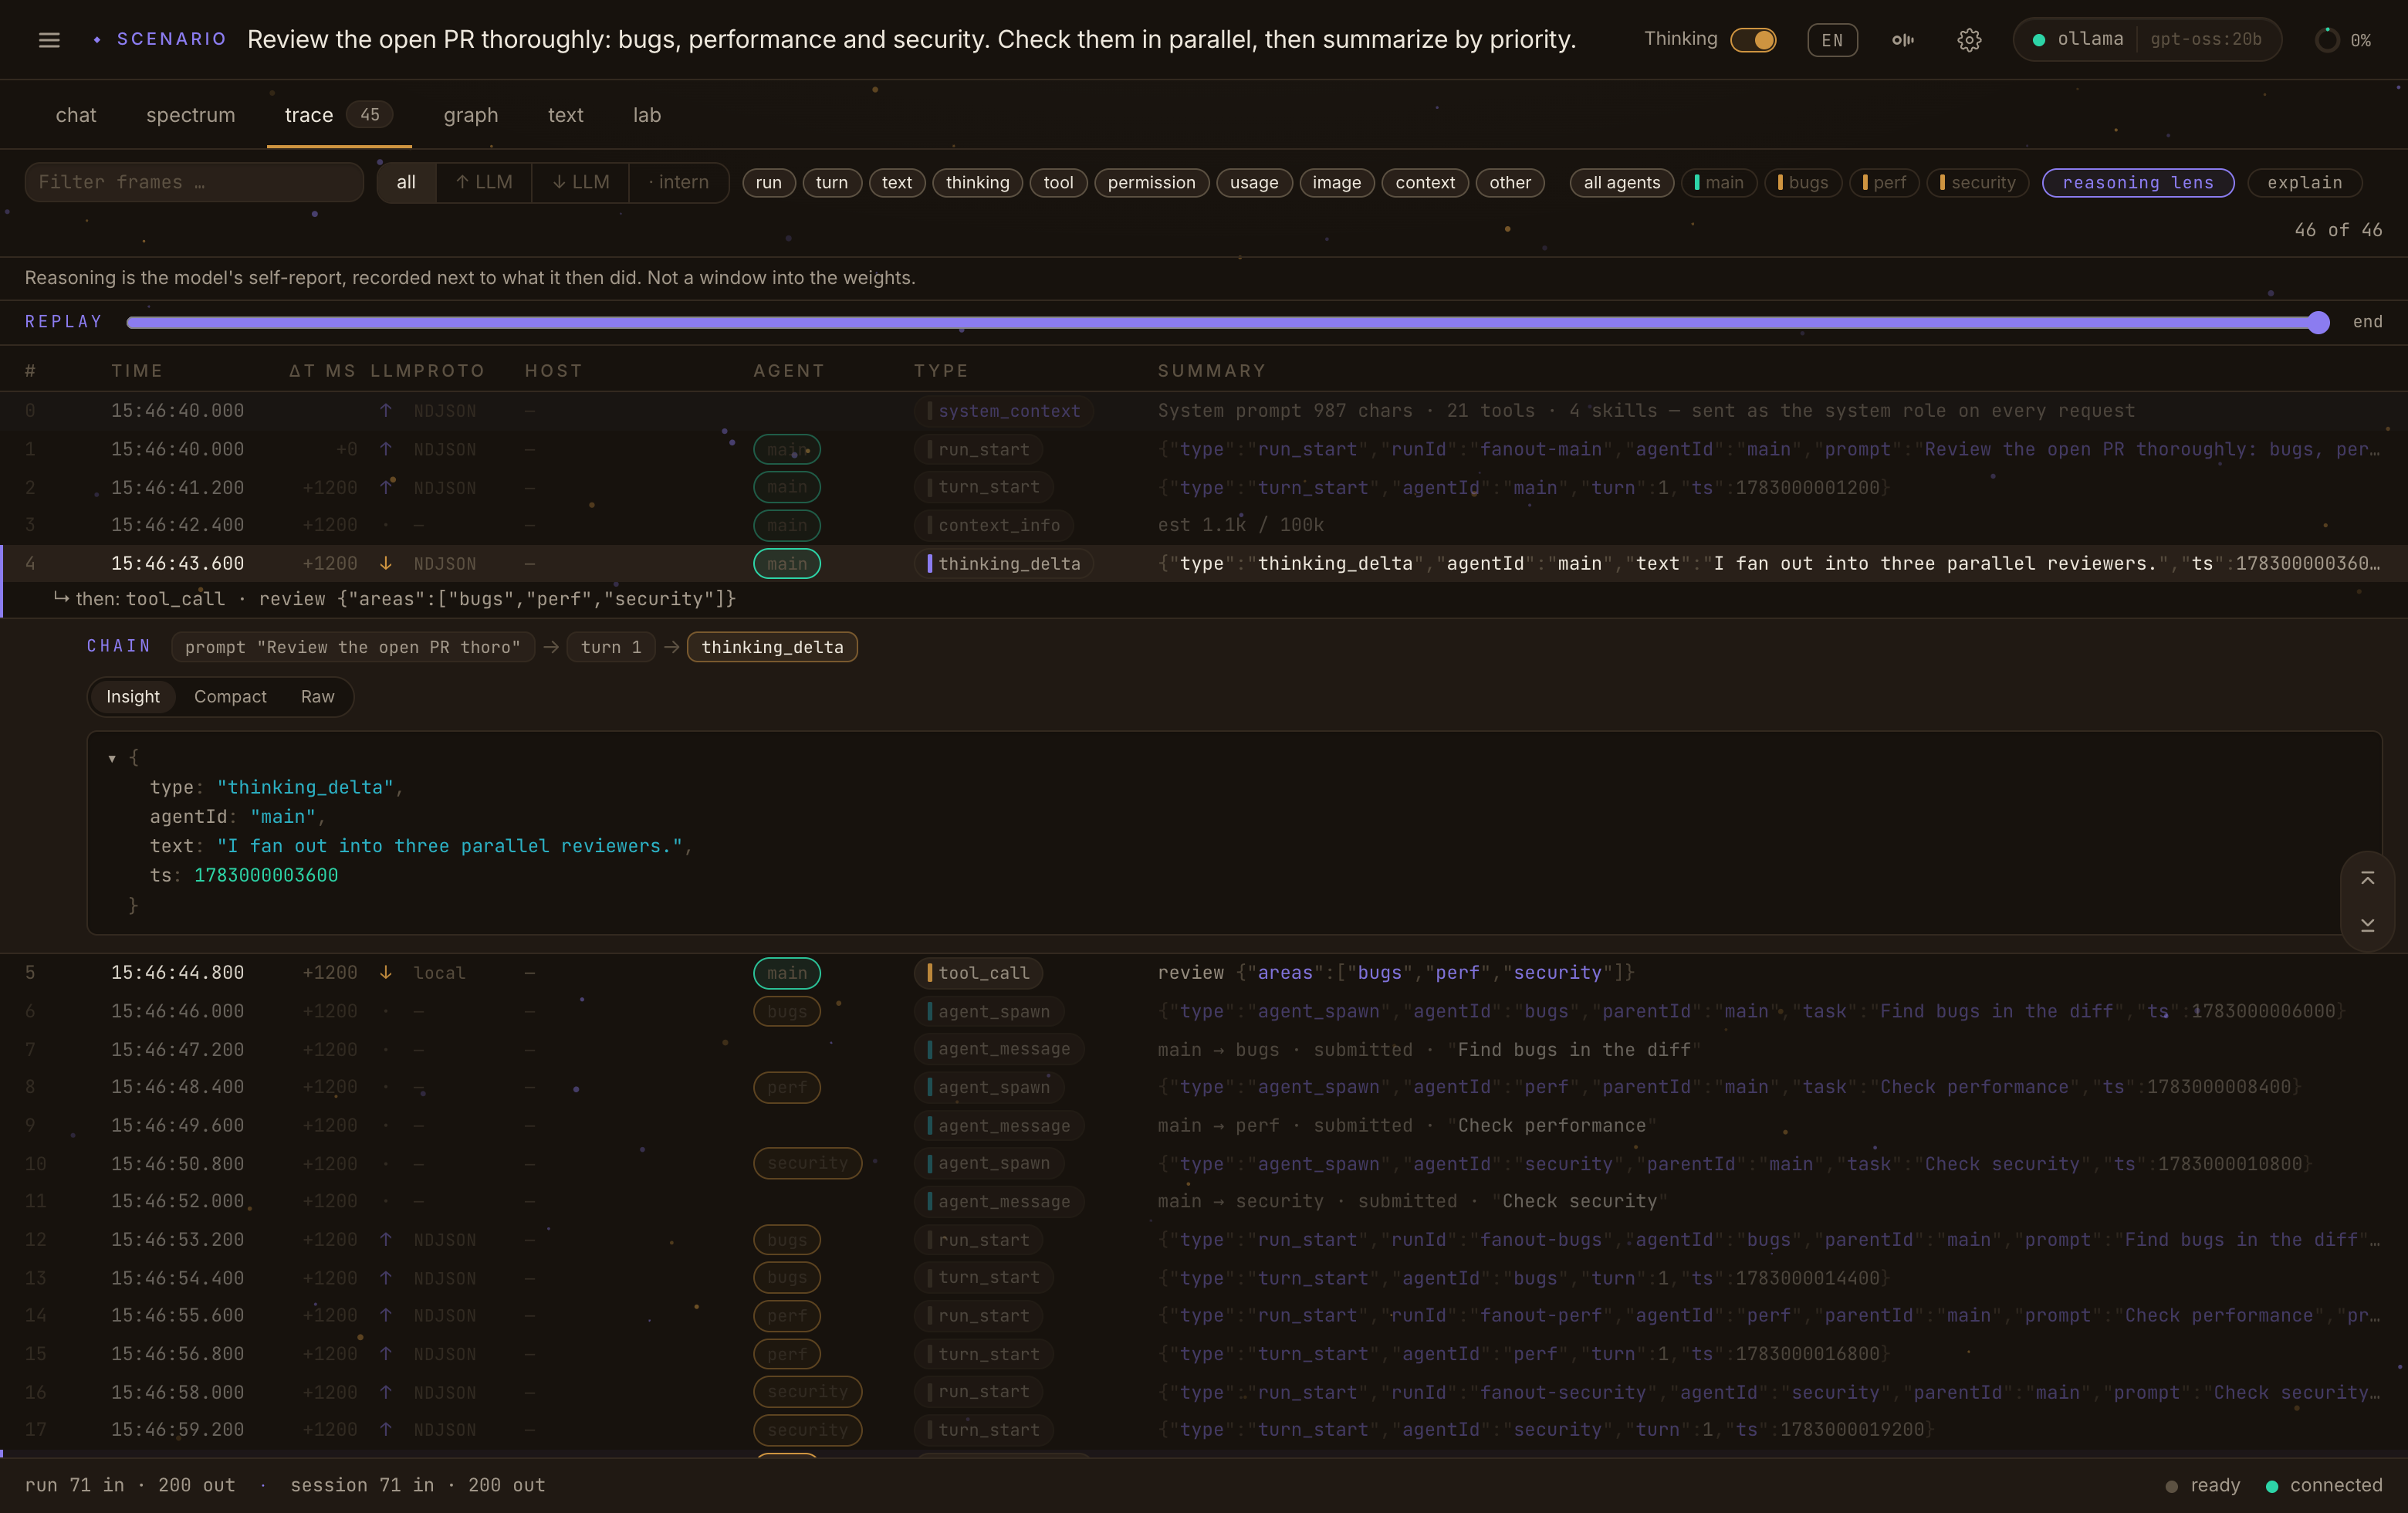
The model's stated thinking lands in the trace as events, next to what it actually did. Put the two side by side, replay them, diff them. That is the model's self-report, not a window into the weights, and we say so. The Trace view ships this as the reasoning lens: see it running below.
spectro explain run.jsonl planned
A run summary in two layers: a deterministic skeleton (tools, costs, gate decisions) and an optional narrative on top. The skeleton already runs live in the trace view; the CLI export is planned.
dispersion
the whole fleet on one screen
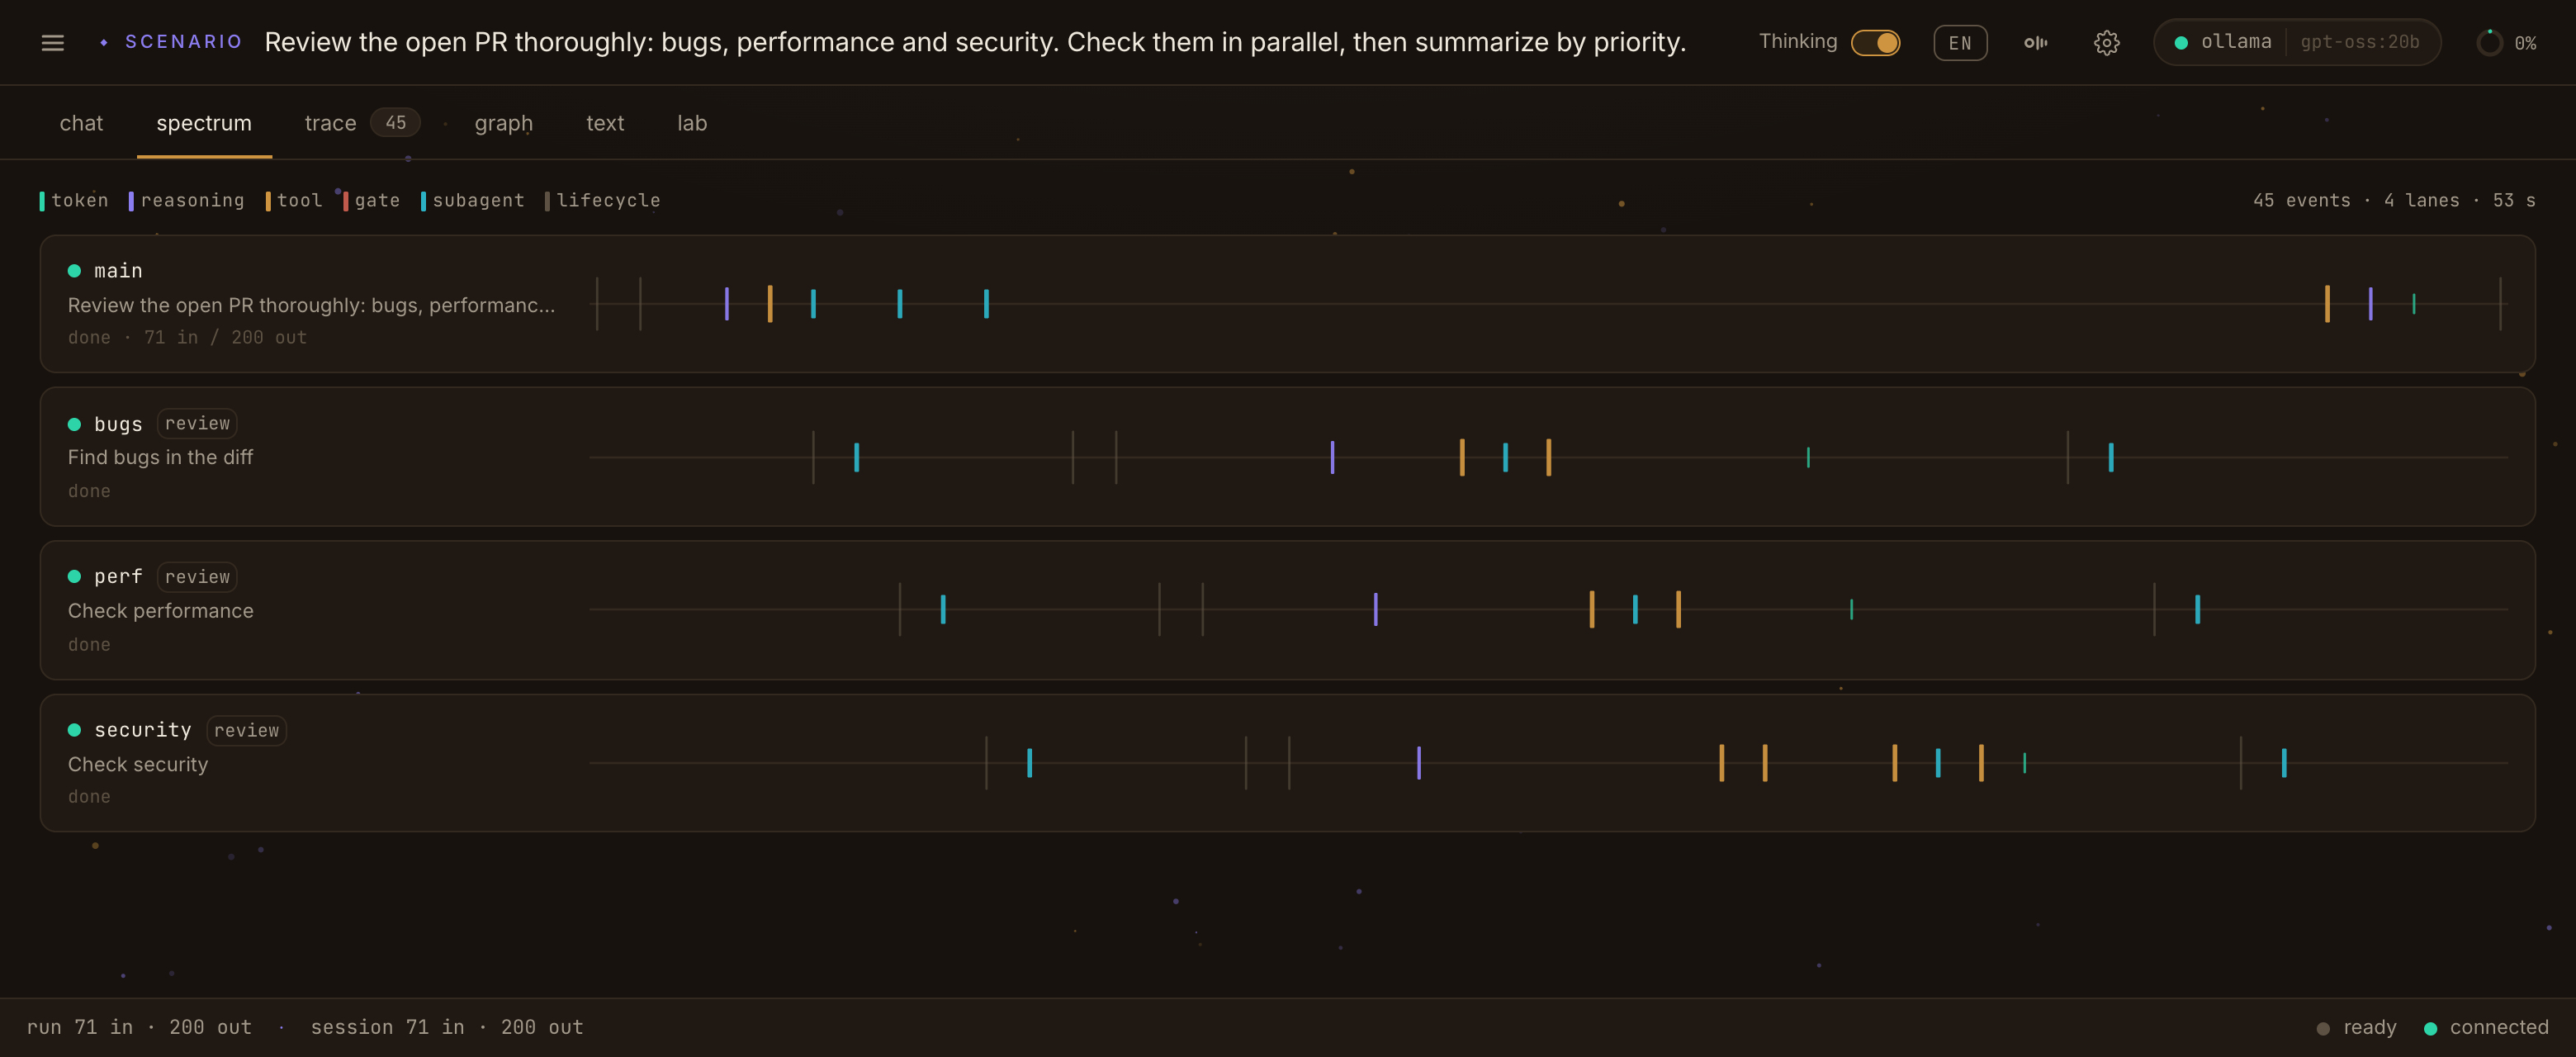
The Orchestrator runs many agents on one bus. The Spectrum tab disperses that single stream into parallel lanes, one line per agent, ordered and steady. You read the fleet the way you read a spectrum: at a glance for the pattern, line by line when something looks off.
drawn before the run
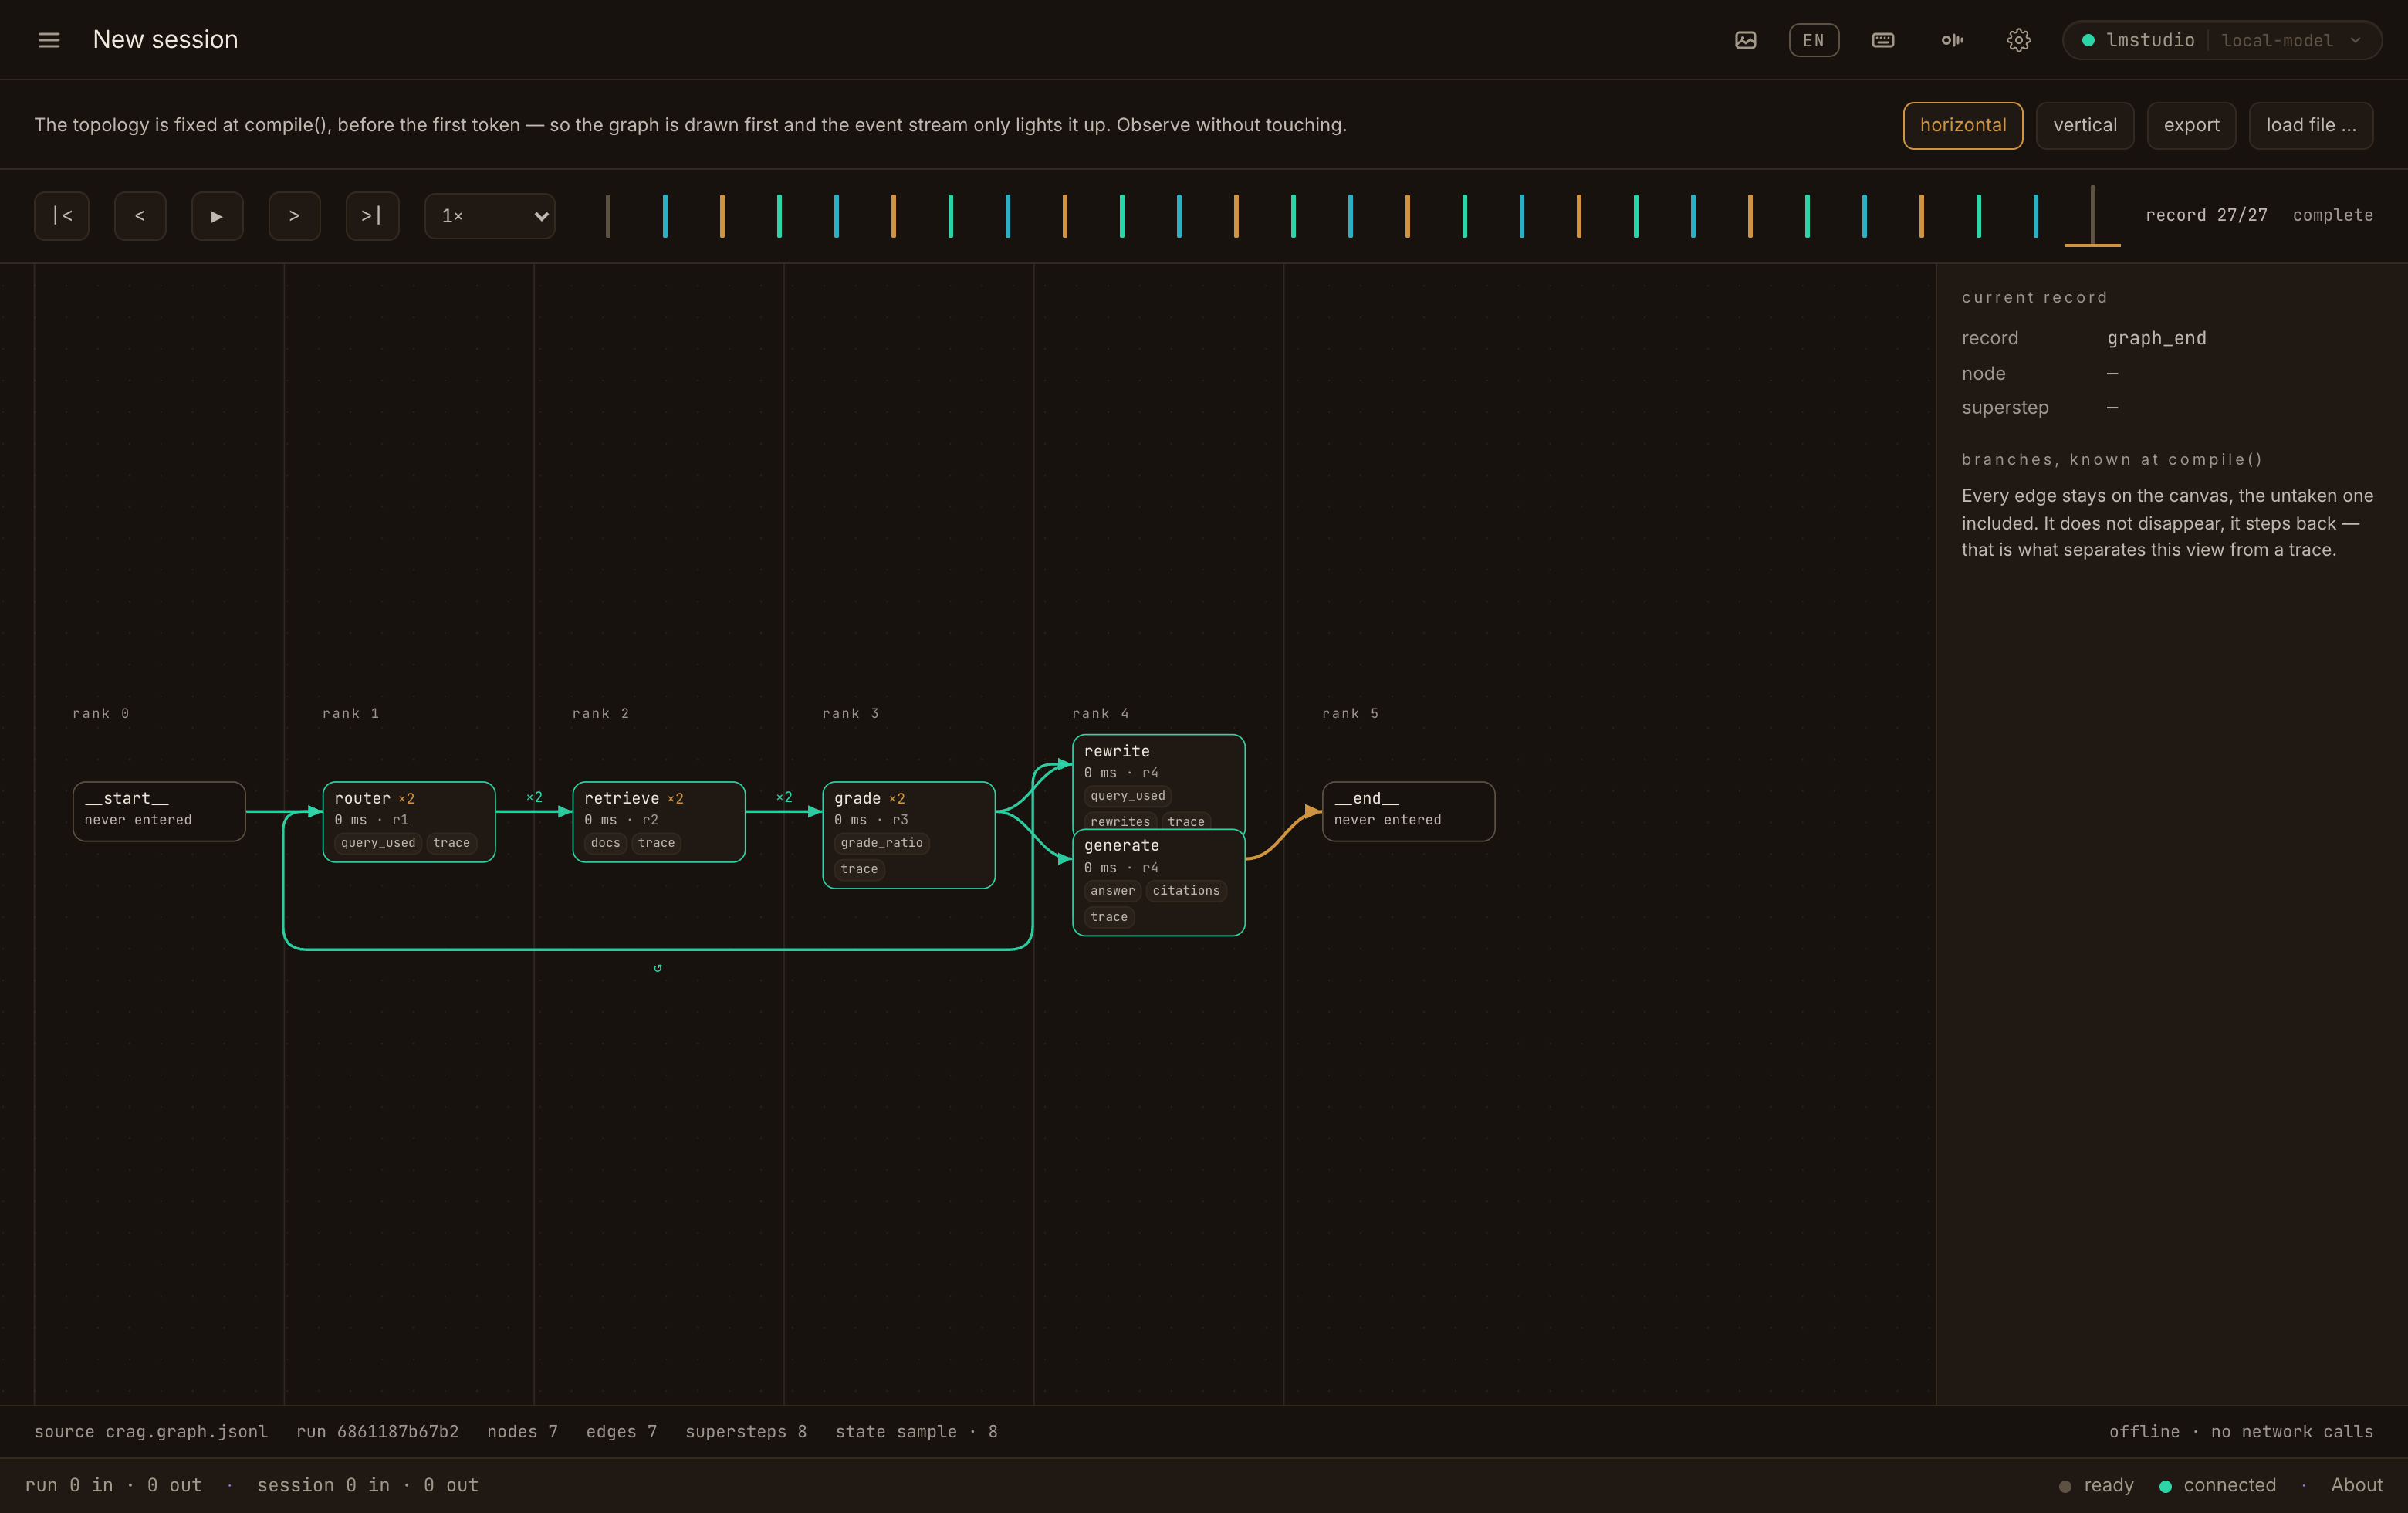
the third surface: a state graph
Everything else here is reconstruction. A run happens, events
arrive, and a view is built from what they said. A graph is the
first thing on these screens that exists before the run:
its topology is fixed at compile(), so the picture is
drawn first and the event stream only lights it up — nodes as they
are entered, edges as they are taken, values as they are written.
Observing without touching, which is what the instrument this
product is named after does.
It sits beside sessions and fleets as the third entry in the sidebar. Five bundled runs load without a key or a network, all of them written by the engine itself. The untaken edge stays on the canvas and steps back rather than vanishing, so what did not happen is still on the page.
straight from the app
a few impressions from the app
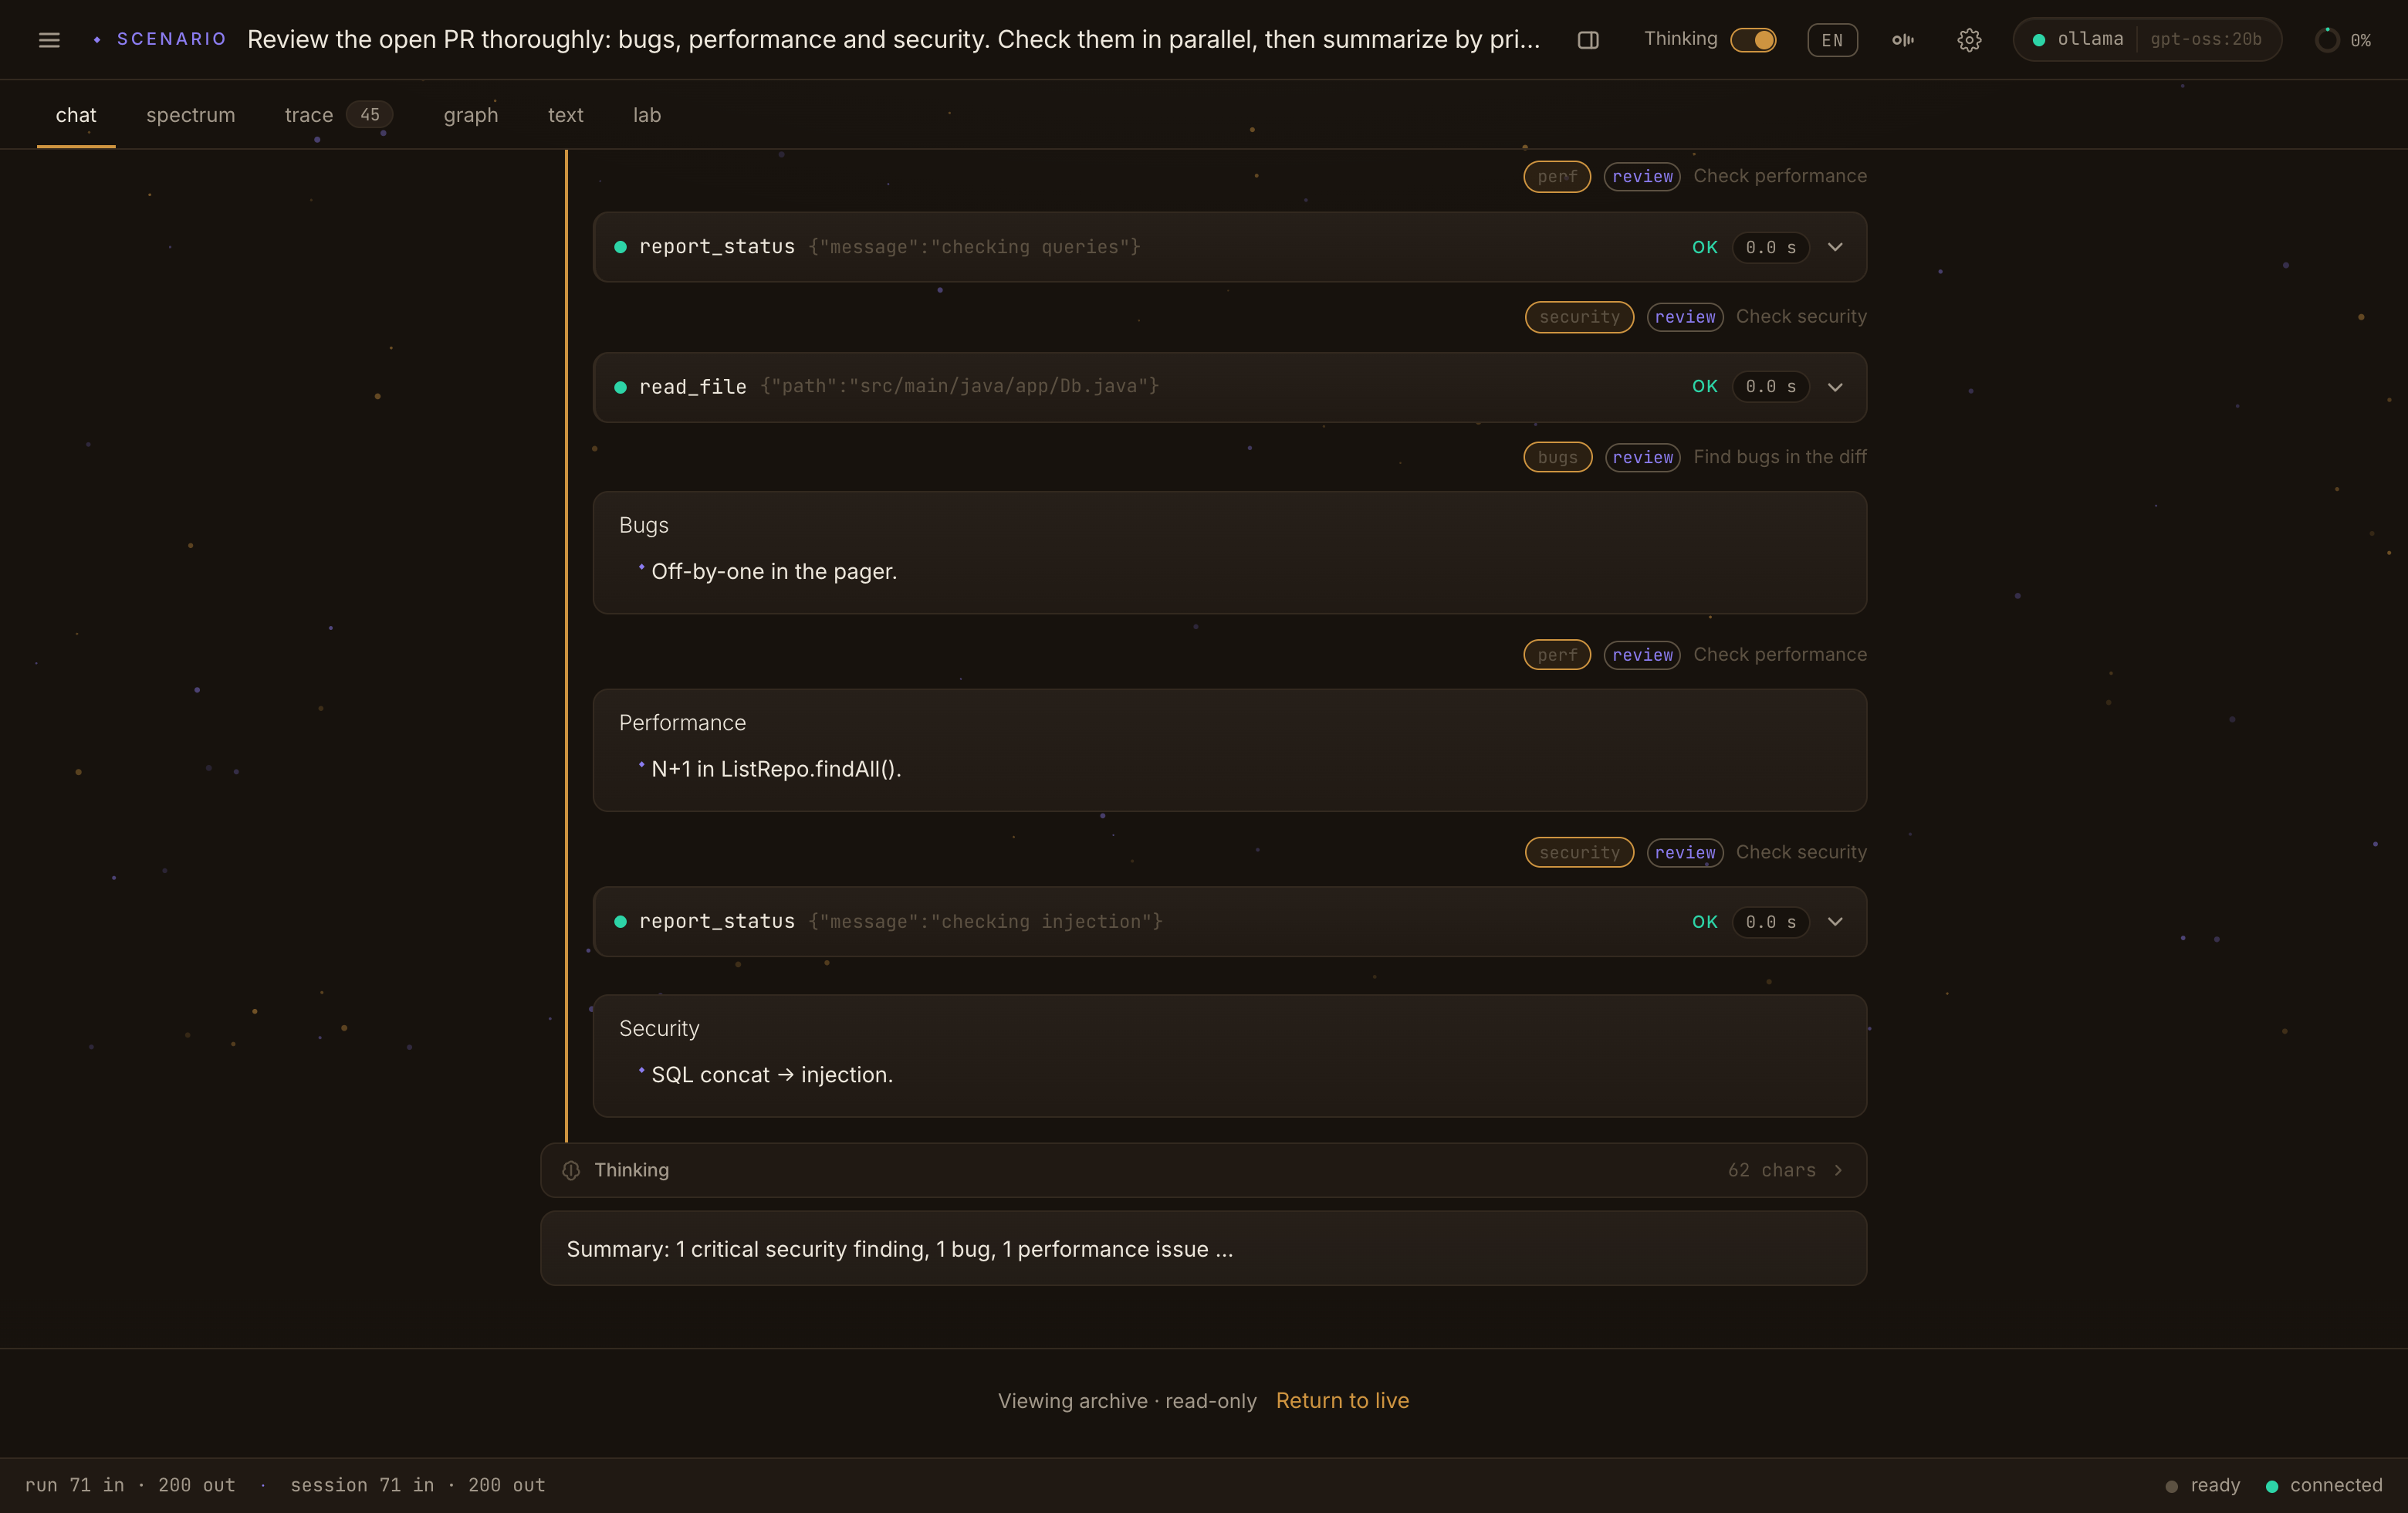
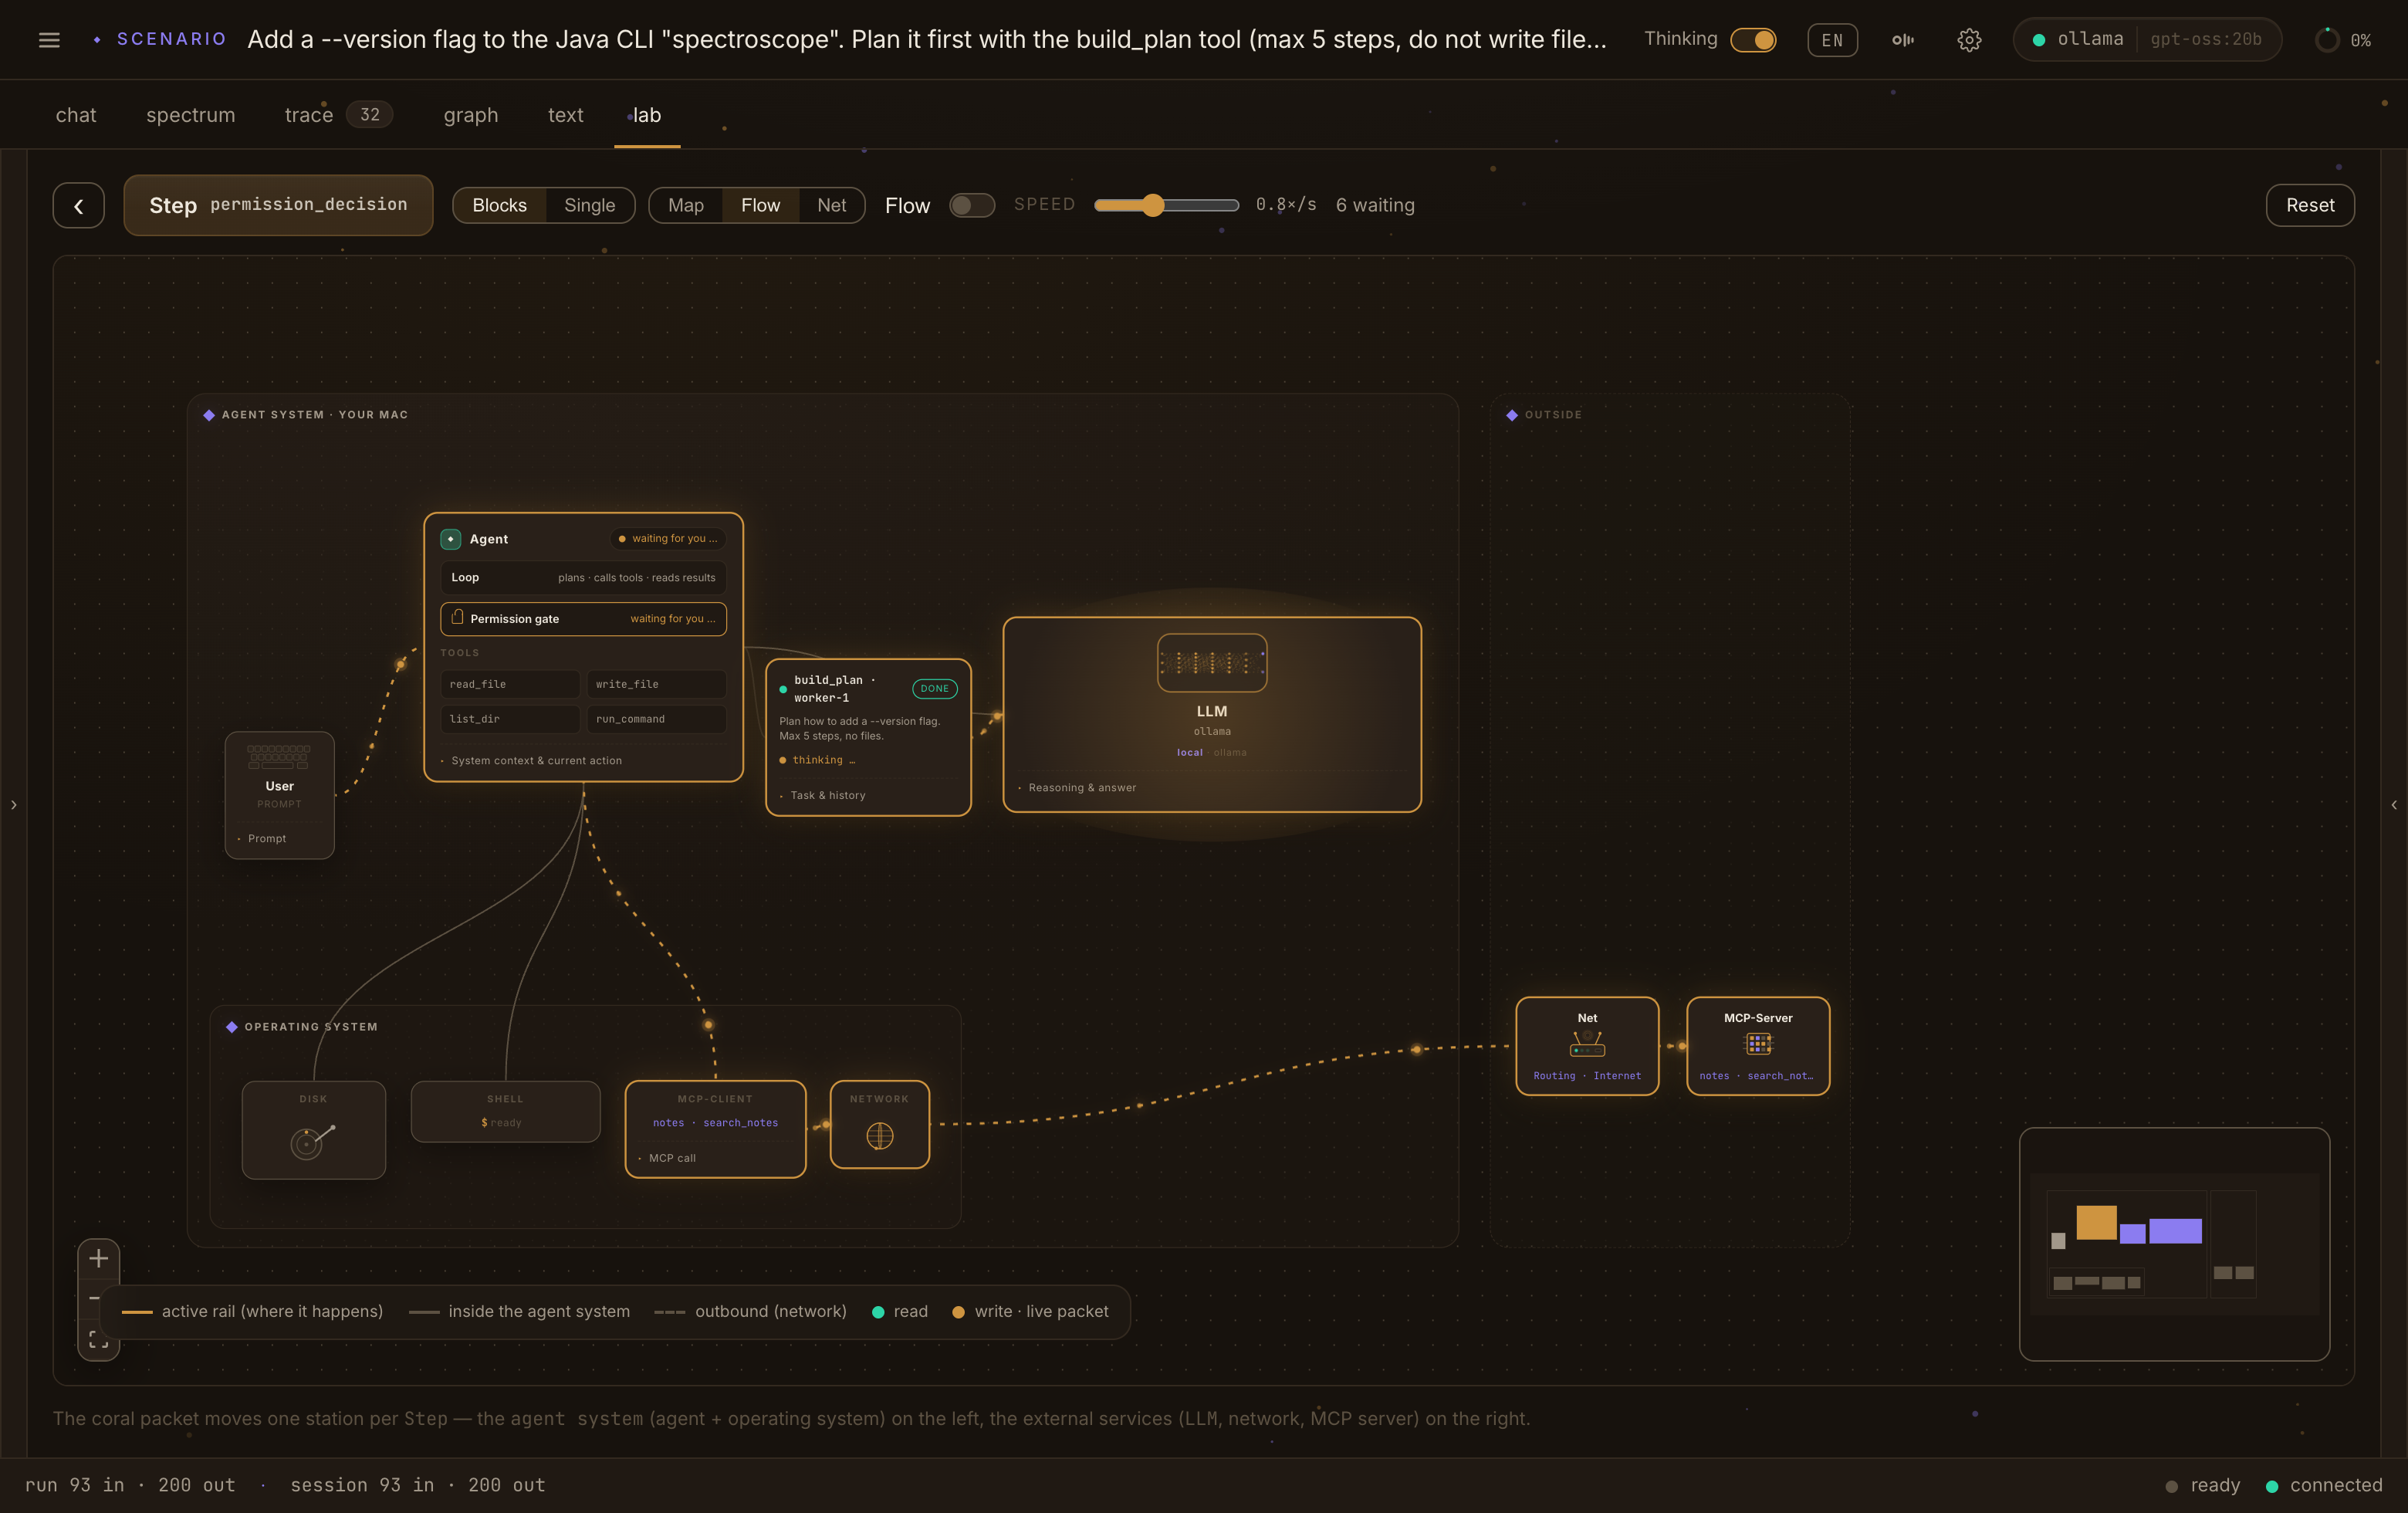
A handful of captures from spectro web — the trace, the fleet spectrum, the fan-out chat, the lab. Every surface runs from a bundled demo scenario, so you can explore it without a key or a server. Want more? See the gallery.
spectral fingerprint
every run leaves a fingerprint
A finished run is a JSONL file: ordered, complete, byte-stable. Like an element's line pattern, the trace identifies exactly what the agent did, which tools it called, and what a human approved. Hand the file to a reviewer and they can read the entire run without access to your machine.
{"seq":12,"type":"tool.call","name":"readFile","gate":"granted"}
light is a record of the past
replay any run, byte for byte
Because the trace is byte-stable JSONL, any run replays exactly as it happened, event by event. Scrub back, pause at the moment a tool call went wrong, and read the surrounding state. A replay is the original stream played again, byte for byte, not a reconstruction.
t = now · playing forward
for regulated teams
trust what you can verify
spectroscope gives a regulated team four properties to check: every action is visible while it runs, gated before it touches the world, explained afterwards, and stored as a byte-stable record anyone can replay. When an auditor asks what the agent did, the answer is a file, and it is the same file you watched being written.
see it
The live stream shows every token, tool call and decision as it happens.
gate it
Every tool call meets the gate; the decision, a human click or an allowlist rule, lands in the trace.
explain it
Every why is answered from the same stream that carries the what.
prove it
Byte-stable JSONL that replays identically, on any machine, any time.
for developers
spawn in five lines. watch every line.
The stream is the observability: iterating it is the instrumentation.
var agent = Spectro.agent()
    .model(Anthropic.opus())
    .tools(Tools.readFile(), Tools.runCommand())
    .workspace(Path.of("/tmp/scratch"));

for (RunEvent event : agent.run("Write hello.py and run it")) {
    System.out.println(event);   // the stream IS the observability
}
from spectroscope import Spectro, Anthropic, Tools
agent = Spectro.agent(
model=Anthropic.opus(),
tools=[Tools.read_file, Tools.run_command,
Tools.spawn_agents],
workspace="/tmp/scratch",
)
for event in agent.run("Write hello.py and run it"):
print(event) # the stream IS the observabilitythe Python port is in design: the JSONL wire is the contract, so the stream reads the same in both
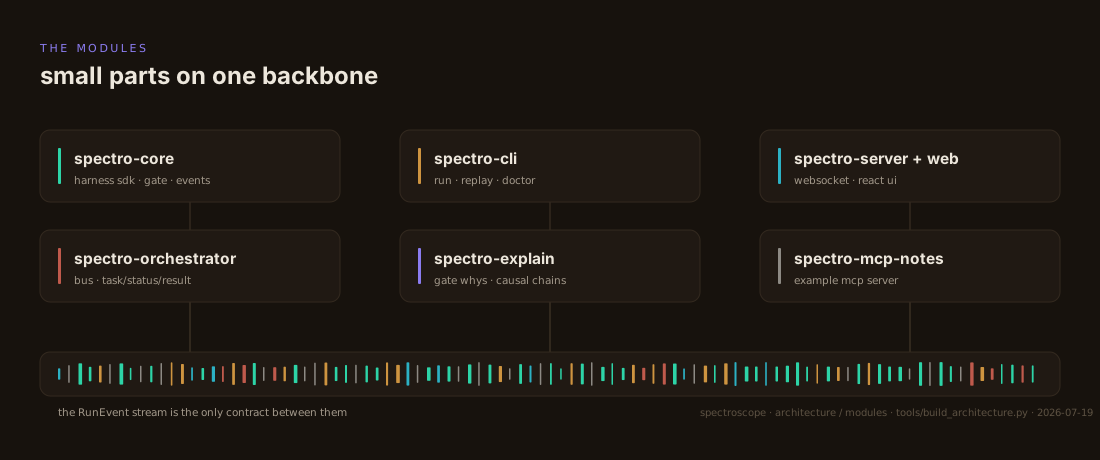
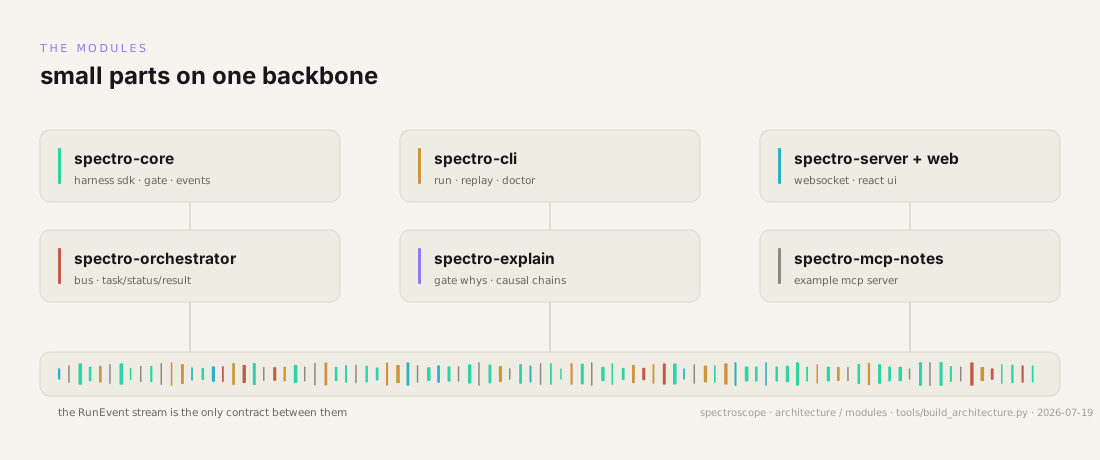
spectro-core
The harness SDK: agents, tools, the permission gate, the typed RunEvent stream. Plain Java 21, virtual threads, no reactive DSL.
spectro-cli
The spectro launcher: run agents, replay traces, and check your setup with spectro doctor.
spectro-server + web
The local web app: Trace, Lab, Graph, and the Spectrum fleet view, all fed by one WebSocket of RunEvents.
spectro-orchestrator
Small agents on one bus, exchanging task, status, and result messages under one correlation id. The one module still under construction.
the JSONL wire format is the compatibility contract: traces recorded anywhere replay everywhere
a stack you can see through
runs on Spring. almost nothing else.
An observability tool earns trust by being observable itself. spectroscope is five small Gradle modules you can read, not a platform you subscribe to.
plain new
spectro-core is a Java 21 library. You instantiate agents with new; there is no container to boot and no annotation processor to please. Spring appears in the core only as its HTTP client.
one ordinary Boot app
The server face is a single Spring Boot application that serves the web UI from its own jar. If you run Spring in production, you already know how to run this.
the whole dependency list
Jackson, Spring's web client, the Anthropic SDK, a cron parser, slf4j. The CLI adds picocli, the faces add logback. There is no agent framework underneath and no vector database to feed.
see-through by design
One typed event stream through every module, one gate for every side effect, every run on disk as JSONL you can open in an editor. Hold the tool up to the light and you can read it, like its namesake.
line spectrum vs blackbody
discrete lines, not blackbox glow
elsewhere
Most agent stacks radiate like a blackbody: plenty of output, no structure you can resolve. Observability is a cloud dashboard, a paid tier, or a listener you remember to register.
spectroscope
spectroscope emits a line spectrum. Because every event is typed, you filter, diff, and replay a run instead of grepping a log after the fact. Local first, permission-gated by design, on the JVM.
how to get it
Four ways in: the cask, the dmg, apt, or a clone. The source is public at github.com/spectroscope/spectroscope, and the libraries for embedding are on Maven Central under the coordinates shown.
homebrew
One line, the fastest way in. Apple silicon only.
$ brew install --cask \
  spectroscope/tap/spectroscope
release dmg
Download and double-click. The image is signed and notarized, so macOS opens it without a warning. It bundles its own JRE and llama-server, so the machine needs no Java and no Homebrew. Apple silicon.
github.com/spectroscope/spectroscope/releases/latest/download/spectroscope-arm64.dmg
# always the newest release; v0.15.5 today
linux · apt
Debian 12 and Ubuntu 24.04, x86_64. Pin the key, add the
source, install; apt upgrade keeps it current from then on, and
~/.spectro survives a removal. For other distributions the release
page carries spectroscope-0.15.5-x86_64.AppImage. There is no arm64
Linux build: apt accepts the source on an arm64 machine and then finds no
package. Key fingerprint and tamper tests:
apt.spectroscope.dev.
curl -fsSL https://apt.spectroscope.dev/spectroscope.asc \
  | sudo gpg --dearmor -o /usr/share/keyrings/spectroscope.gpg
echo "deb [signed-by=/usr/share/keyrings/spectroscope.gpg] https://apt.spectroscope.dev stable main" \
  | sudo tee /etc/apt/sources.list.d/spectroscope.list
sudo apt update
sudo apt install spectroscope
from source
The whole app builds from a clone; the launcher resolves a JDK 21+ for you.
$ git clone https://github.com/spectroscope/spectroscope.git
$ cd spectroscope
$ ./spectro web start  # web UI → http://127.0.0.1:8080, in the background
$ ./spectro doctor     # environment check
maven
<dependency>
  <groupId>dev.spectroscope</groupId>
  <artifactId>spectro-core</artifactId>
  <version>0.15.5</version>
</dependency>
user guide
Every surface in one book, from the
thirty-second start to the fleet reference.
read it in the browser ·
dark
pdf: light · 22 MB ·
dark · 22 MB
local setup
The tools that run beside the app on macOS and
Linux: Java for the jar, a local model, speech, web search and the code
graph. Each step says how to check that it worked. Where a step has a
command, it has a copy button; where it has a script, you can download
it and read it first.
open local setup
v0.15.5 released · when the model ends its turn with a question to you, the run stops there and your answer comes first; the main agent is told that an explore helper can use the code graph · MIT licensed: use it commercially, fork it, ship it

read your agents like starlight.